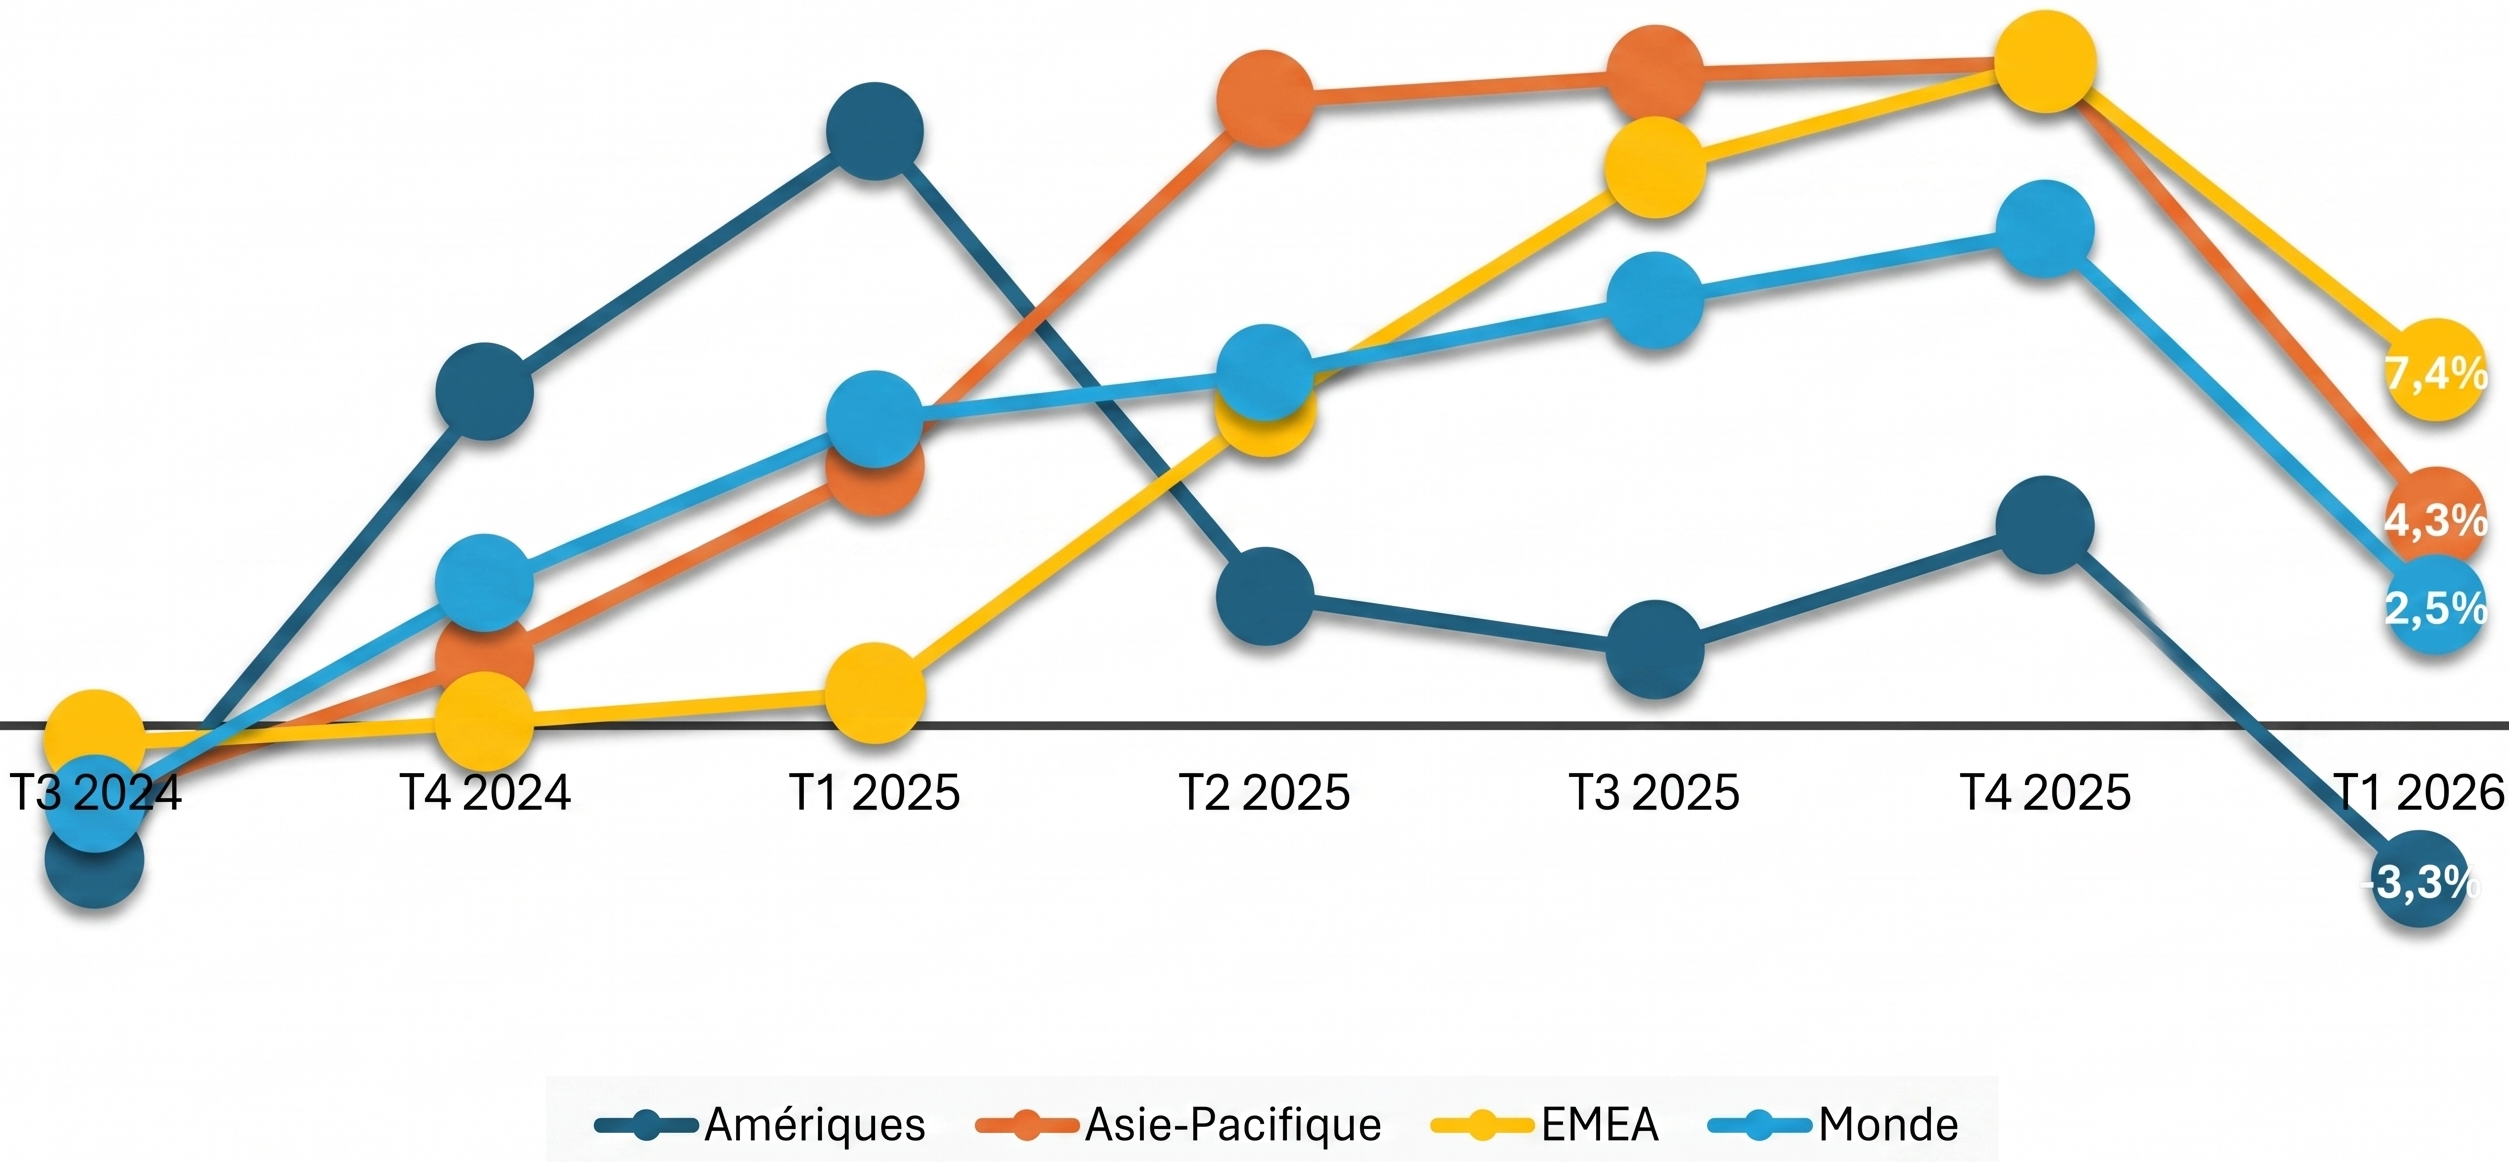
Component shortages, tariffs, energy prices, and disruptions in maritime logistics… The headwinds piling up against the technology hardware sector are beginning to weigh on sales volumes.
Data from Gartner and IDC on the PC market illustrate this trend. After a few months of growth driven by stockpiling, shipments — to distributors and end users — declined sharply in Q1 2026.
Q3 2025: Slowdown in North America after the stockpiling surge to dodge tariffs
Upstream momentum was not uniform. In North America, it was limited to 1.6% in Q3 2025. Demand had indeed concentrated in the first six months of the year, in anticipation of the tariffs announced by Washington. Gartner noted, for the consumer segment, a persistent tendency to postpone purchases. IDC, for its part, signaled that the notable growth recorded in the Asia-Pacific region owed less to the adoption of Windows 11 (seen as “slow”) than to GIGA, a $4 billion program that Japan launched to digitize primary and secondary education.
| (Gartner) | Deliveries Q3 2025 (millions) | Market Share Q3 2025 | Deliveries Q3 2024 (millions) | Market Share Q3 2024 | Growth 2024-2025 |
|---|---|---|---|---|---|
| Lenovo | 19.421 | 27.8% | 16.649 | 25.8% | 16.6% |
| HP | 15.002 | 21.5% | 13.561 | 21.0% | 10.6% |
| Dell | 10.166 | 14.5% | 9.919 | 15.4% | 2.5% |
| Apple | 6.203 | 8.9% | 5.605 | 8.7% | 10.7% |
| ASUS | 5.383 | 7.7% | 5.1 | 7.9% | 5.5% |
| Autres | 13.740 | 19.7% | 13.777 | 21.3% | -0.3% |
| Total | 69.914 | 100% | 64.611 | 100% | 8.2% |
| (IDC) | Deliveries Q3 2025 (millions) | Market Share Q3 2025 | Deliveries Q3 2024 (millions) | Market Share Q3 2024 | Growth 2024-2025 |
|---|---|---|---|---|---|
| Lenovo | 19.4 | 25.5% | 16.5 | 23.8% | 17.3% |
| HP | 15 | 19.8% | 13.6 | 19.6% | 10.7% |
| Dell | 10.1 | 13.3% | 9.8 | 14.2% | 2.6% |
| Apple | 6.8 | 9.0% | 6 | 8.7% | 13.7% |
| ASUS | 5.9 | 7.8% | 5.3 | 7.7% | 11.4% |
| Autres | 18.6 | 24.5% | 18.1 | 26.1% | 3% |
| Total | 75.9 | 100% | 69.3 | 100% | 9.4% |
Q4 2025: Stockpiling rush
Facing component shortages (memory foremost; processors and disks are also under pressure), inventory protection manifested in the figures for the fourth quarter of 2025.
| (Gartner) | Deliveries Q4 2025 (millions) | Market Share Q4 2025 | Deliveries Q4 2024 (millions) | Market Share Q4 2024 | Growth 2024-2025 |
|---|---|---|---|---|---|
| Lenovo | 19.437 | 27.2% | 17.004 | 26% | 14.3% |
| HP | 15.392 | 21.5% | 13.73 | 21% | 12.1% |
| Dell | 11.783 | 16.5% | 9.97 | 15.2% | 18.2% |
| Apple | 6.689 | 9.4% | 6.327 | 9.7% | 5.7% |
| ASUS | 4.851 | 6.8% | 4.718 | 7.2% | 2.8% |
| Acer | 4.165 | 5.8% | 4.131 | 6.3% | 0.8% |
| Autres | 9.18 | 12.8% | 9.529 | 14.6% | -3.7% |
| Total | 71.496 | 100% | 65.409 | 100% | 4% |
| (IDC) | Deliveries Q4 2025 (millions) | Market Share Q4 2025 | Deliveries Q4 2024 (millions) | Market Share Q4 2024 | Growth 2024-2025 |
|---|---|---|---|---|---|
| Lenovo | 19.3 | 25.3% | 16.9 | 24.2% | 14.4% |
| HP | 15.4 | 20.1% | 13.7 | 19.7% | 12.1% |
| Dell | 11.7 | 15.3% | 9.9 | 14.2% | 18.2% |
| Apple | 7.1 | 9.3% | 7.1 | 10.2% | 0.2% |
| ASUS | 5.4 | 7.1% | 4.9 | 7% | 10.9% |
| Autres | 17.4 | 22.8% | 17.2 | 24.7% | 1.5% |
| Total | 76.4 | 100% | 69.7 | 100% | 9.6% |
Q1 2026: An additional geopolitical wildcard
The momentum continued into the first quarter of 2026, particularly for low-margin products, with Gartner characterizing the growth as artificial… yet it still slowed across all geographic regions. IDC, however, remains more sanguine. It treats the situation in the Middle East as a double-edged blade: on one hand, disruption of maritime corridors; on the other, higher freight costs for air transport.
| (Gartner) | Deliveries Q1 2026 (millions) | Market Share Q1 2026 | 1Q25 Shipments | Market Share Q1 2025 | Growth 2025-2026 |
|---|---|---|---|---|---|
| Lenovo | 16.645 | 26.5% | 15.199 | 25.2% | 9.5% |
| HP | 12.142 | 19.3% | 12.766 | 21.1% | -4.9% |
| Dell | 10.337 | 16.5% | 9.608 | 15.9% | 7.6% |
| Apple | 6.684 | 10.6% | 5.933 | 9.8% | 12.7% |
| ASUS | 4.21 | 6.7% | 3.801 | 6.3% | 10.8% |
| Acer | 4.001 | 6.4% | 3.853 | 6.4% | 3.9% |
| Autres | 8.78 | 14% | 9.205 | 15.2% | -4.6% |
| Total | 62.8 | 100% | 60.365 | 100% | 4% |
| (IDC) | Deliveries Q1 2026 (millions) | Market Share Q1 2026 | Deliveries Q1 2025 (millions) | Market Share Q1 2025 | Growth 2025-2026 |
|---|---|---|---|---|---|
| Lenovo | 16.5 | 25.2% | 15.2 | 23.8% | 8.6% |
| HP | 12.1 | 18.5% | 12.8 | 20.0% | -4.9% |
| Dell | 10.3 | 15.7% | 9.6 | 14.9% | 7.7% |
| Apple | 6.2 | 9.5% | 5.7 | 8.9% | 9.1% |
| ASUS | 4.8 | 7.2% | 4.1 | 6.3% | 17.1% |
| Autres | 15.7 | 23.9% | 16.7 | 26.1% | -6.2% |
| Total | 65.6 | 100% | 64 | 100% | 2.5% |
More value, fewer volumes: the outlook for a “new normal”… with no entry-level?
At the end of February, Gartner suggested a 10.4% drop in PC shipment volumes in 2026 versus 2025. It projected a similar dynamic for smartphones (−8.4%). By year’s end, combined DRAM and SSD costs were expected to have risen 130%. Consequently, the price of a PC could be up 17% year over year (vs. +13% for a smartphone), with memory accounting for up to 23% of their hardware cost (vs. 16% in 2025). Under these conditions, one would expect, on the one hand, devices to have a longer lifecycle (+15% for business PCs; +20% for consumer), and, on the other hand, the possible disappearance, by 2028, of sub-$500 PC segments. Similar trends were predicted for smartphones, where the entry level appeared most exposed, especially against refurbished devices and used opportunities.
In mid-March, IDC issued a somewhat more pessimistic forecast: −11.3% for PCs (and −7.6% for tablets). Even with rising selling prices, the market was expected to grow in value: +1.6% for PCs (to 274 billion dollars) and +3.9% for tablets (66.8 billion dollars). Prices were anticipated to fall again after 2028, according to IDC. But the market would not return to its 2025 level: businesses should prepare for a “new normal” with higher average prices and lower volumes.